The "Sun King" Effect
How India’s Solar Story Quietly Became a Geography Story
India’s solar journey is often narrated as a success of scale — record installations, falling tariffs, and rapid capacity additions across states. That narrative, while broadly correct, now masks a deeper structural shift underway.
Solar growth in India is no longer evenly distributed. It has entered a phase of extreme geographic concentration, where a small cluster of states increasingly determines national outcomes — not just in generation volumes, but in grid stress, price behaviour, and system reliability.
This analysis looks beyond capacity announcements and examines actual generation, revealing how India’s solar story has narrowed into a powerful Western corridor.
From Broad-Based Ambition to Concentrated Reality
At first glance, India’s solar map appears expansive. Almost every state reports installed capacity. But generation data tells a more selective story.
The Top 4 States (Rajasthan, Gujarat, Tamil Nadu, Karnataka) now generate approximately 74% of India's total solar power. Within this, Rajasthan is an outlier; in late 2025, it alone generated ~4,700+ MU—roughly 35% of the entire country's output.
The map makes this immediately visible. Solar intensity no longer radiates outward from multiple centres. It clusters — heavily — in the West.
This concentration raises a natural question: why here, and why now?
The Great Divergence in State-Level Solar Growth
India’s solar expansion has not followed a uniform path. Instead, state trajectories have diverged sharply, shaped by land availability, grid readiness, and development strategy.
Three distinct patterns emerge.
1. Rajasthan: The Hockey Stick Curve
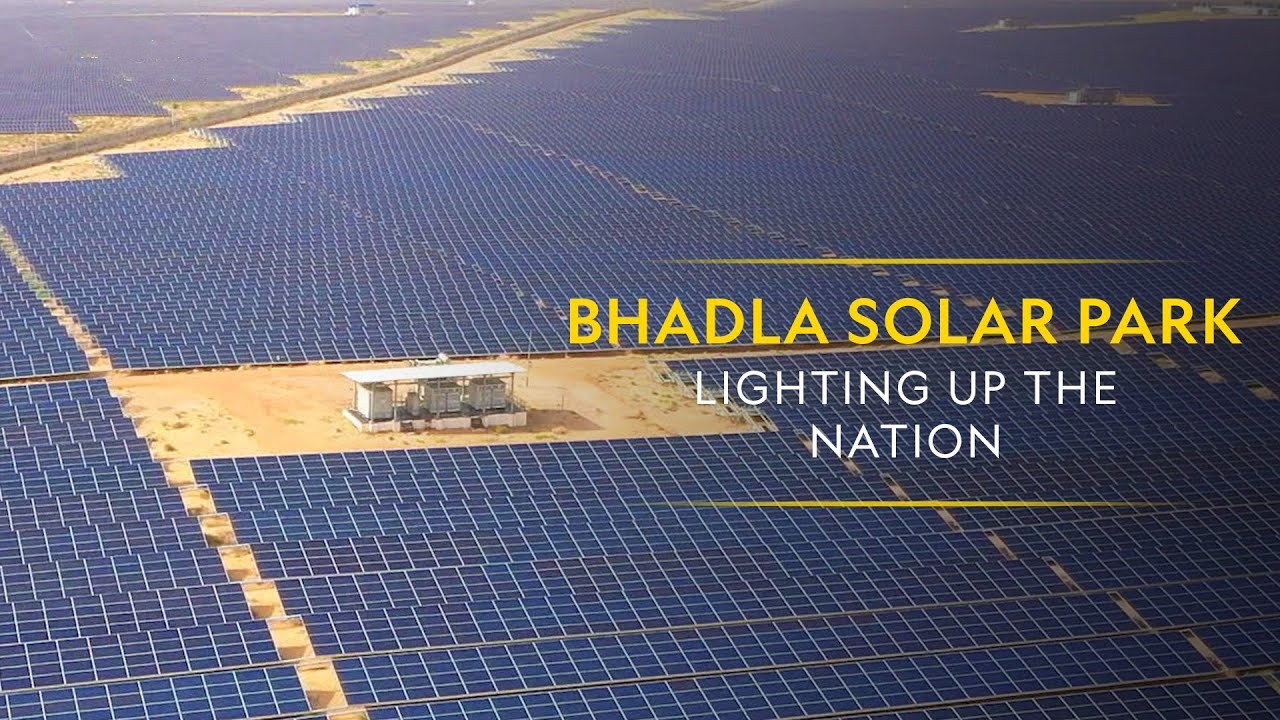
Rajasthan's production leaped from ~1,000 MU to nearly 4,800 MU in just a few years. Growth here is vertical, driven by massive utility-scale parks like Bhadla.
2. Gujarat: The 3x Resurgence
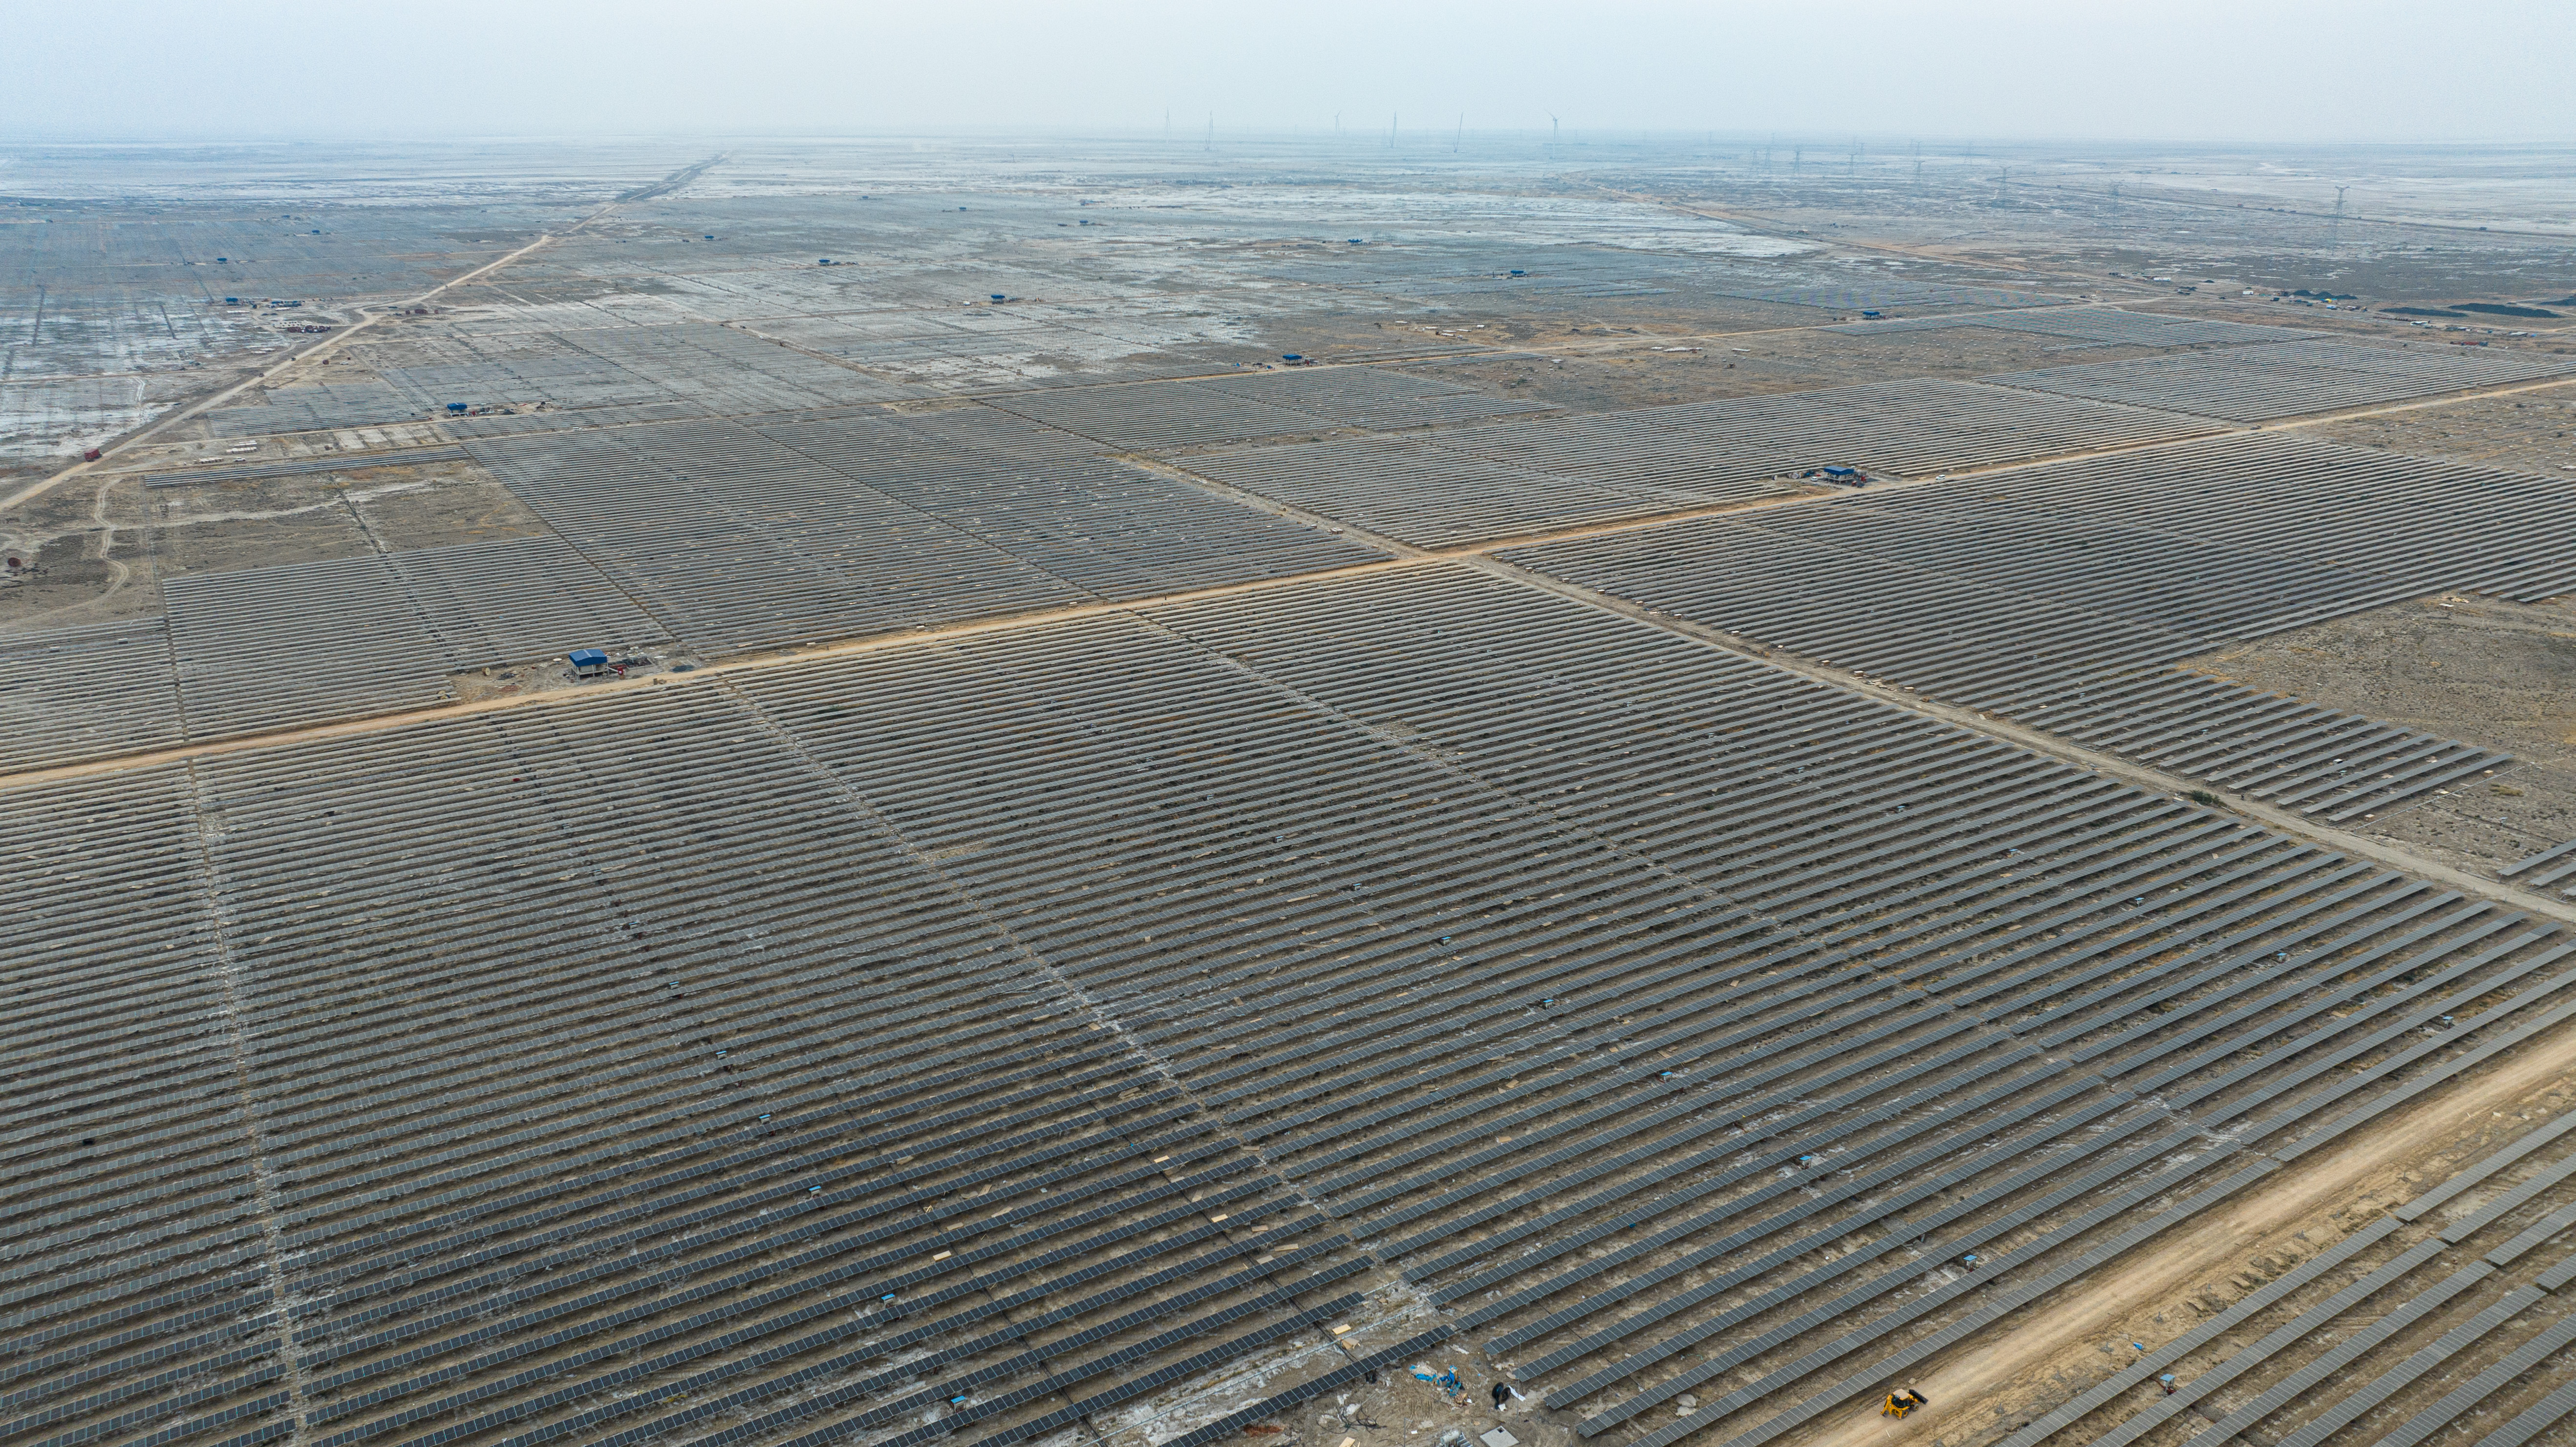
After a multi-year plateau, Gujarat tripled its generation in 36 months, reclaiming the #2 spot nationally with the Khavda Renewable Energy Park initiative.
3. The Southern Plateau
Early solar pioneers Karnataka and Telangana have seen their growth curves stabilize as they move from capacity addition to grid optimization.
Comparative Growth Metrics (2020 vs 2025)
| State | 2020 Monthly Avg (MU) | 2025 Monthly Avg (MU) | Growth Factor |
|---|---|---|---|
| Rajasthan | 847 | 4,796 | 5.7x |
| Gujarat | 361 | 2,021 | 5.6x |
| Maharashtra | 211 | 775 | 3.7x |
| Tamil Nadu | 496 | 1,516 | 3.1x |
| Karnataka | 1,133 | 1,392 | 1.2x |
| Telangana | 528 | 575 | 1.1x |
Rajasthan and Gujarat have scaled solar primarily due to structural and planning advantages. Rajasthan benefits from vast contiguous land parcels, high and stable solar irradiance, and early alignment with interstate transmission corridors. Park-based development reduced land aggregation and evacuation risks, enabling rapid scale-up and efficient conversion of capacity into generation. Gujarat’s growth, after an initial plateau, has been driven by a renewed focus on large utility-scale projects and closer coordination between capacity addition and transmission readiness, helping absorb higher volumes of solar generation with relatively lower early-stage curtailment.
Southern states such as Karnataka and Telangana reflect an early-mover maturity effect. These states expanded solar capacity earlier, when land availability and grid headroom were relatively unconstrained. Over time, rising grid loading, limited evacuation margins, and increasing balancing requirements have moderated further generation growth. The flatter trend is therefore a function of system saturation and operational constraints, rather than weaker solar resources or policy support.
Solar Is Not Uniform Through the Year
As solar becomes system-relevant, seasonality matters more than annual averages. Different geographies experience different weather shocks:
- Western deserts deliver steadier year-round output
- Coastal and southern states face sharper monsoon or cloud-driven dips
- Winter fog and aerosols affect northern output
By indexing monthly generation against annual averages, seasonal patterns become clear. Rajasthan’s relative stability contrasts with sharper monsoon volatility elsewhere. As solar concentrates geographically, these seasonal effects begin influencing national grid stability and price formation, not just local performance.
Understanding Indexation: Raw generation data often masks seasonality because capacity is constantly increasing. We use Indexation (Base = 100) to isolate weather effects. An index of 115 means the month performed 15% above the annual average; 85 means 15% below.
Why Some Large States Still Lag
Uttar Pradesh
Despite its massive land area and population, UP remains a vast underperformer. While it has grown to ~400+ MU, it captures only a fraction of its technical potential compared to Western leaders.
Assam & North East
Generation remains minimal at ~27 MU/month. Rajasthan generates in a few hours what the entire North East generates in a month, highlighting a severe infrastructure gap.
The absence of major solar generation in these states is often framed as untapped potential. The reality is more structural.
Fragmented land ownership, weaker transmission backbones, and limited grid headroom have prevented demand growth from translating into generation. Solar expansion today requires more than sunlight and policy intent — it requires buildable land with evacuation certainty.
What the “Sun King” Effect Really Means
The phrase “Sun King” is used here as an analytical metaphor. Historically, the term referred to Louis XIV of France, under whose reign political and economic power became intensely centralised — with the stability of the entire system increasingly dependent on one dominant centre.
The “Sun King” effect is not a flaw — it is a signal. A signal that solar has become large enough to reshape the power system itself.
India’s solar future will not be decided only by how many panels are installed, but by how intelligently geography, grids, and markets are stitched together.
The country has solved for cost and scale. It now faces questions of architecture.